
こんにちは! インフラジスティックス・ジャパン、テクニカル コンサルティング チームの石橋です。
「はじめての React」シリーズでは React が初めての人向けに React のアプリケーションの作成方法を順に説明したいと思います。Hello World から始めてインフラジスティックス製品の Ignite UI for React のグリッドやチャートを配置するところまでを目指します。
この記事はその第 2 回。Ignte UI for React のグリッドを表示させるところまで進めていきます。
連載目次
- 開発環境を整える。
- React のアプリケーションを動かしてみる。
- "Hello World!" と表示されるように書き換える。(前回の「はじめての React ①」はここまで)
- Ignite UI for React のグリッドを配置する。(←今回はここ)
- Ignite UI for React のチャートを配置する。
4. Ignite UI for React のグリッドを配置する。
Ignite UI for React のグリッドはデータを表形式で表示することができます。
グリッドに必要なパッケージをインストールする。
グリッドに必要なパッケージは以下の 4 つです。
- igniteui-react-core
- igniteui-react-grids
- igniteui-react-inputs
- igniteui-react-layouts
これらを npm の install コマンドを使用してインストールします。
プロンプトで次のコマンドを順に実行します。
> npm install --save igniteui-react-core
> npm install --save igniteui-react-grids
> npm install --save igniteui-react-inputs
> npm install --save igniteui-react-layouts
MyGrid コンポーネントを作成する。
前回の「はじめての React - ① Hello World」で HelloWorld コンポーネントを作成したのと同じ手順で、src フォルダーの直下に MyGrid コンポーネントを作成します。
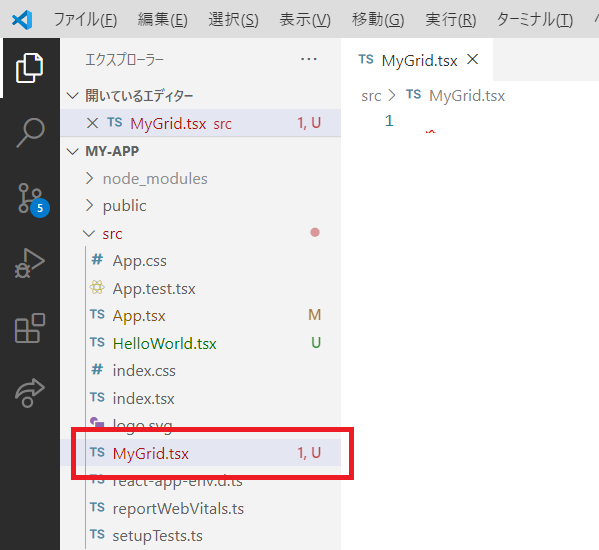
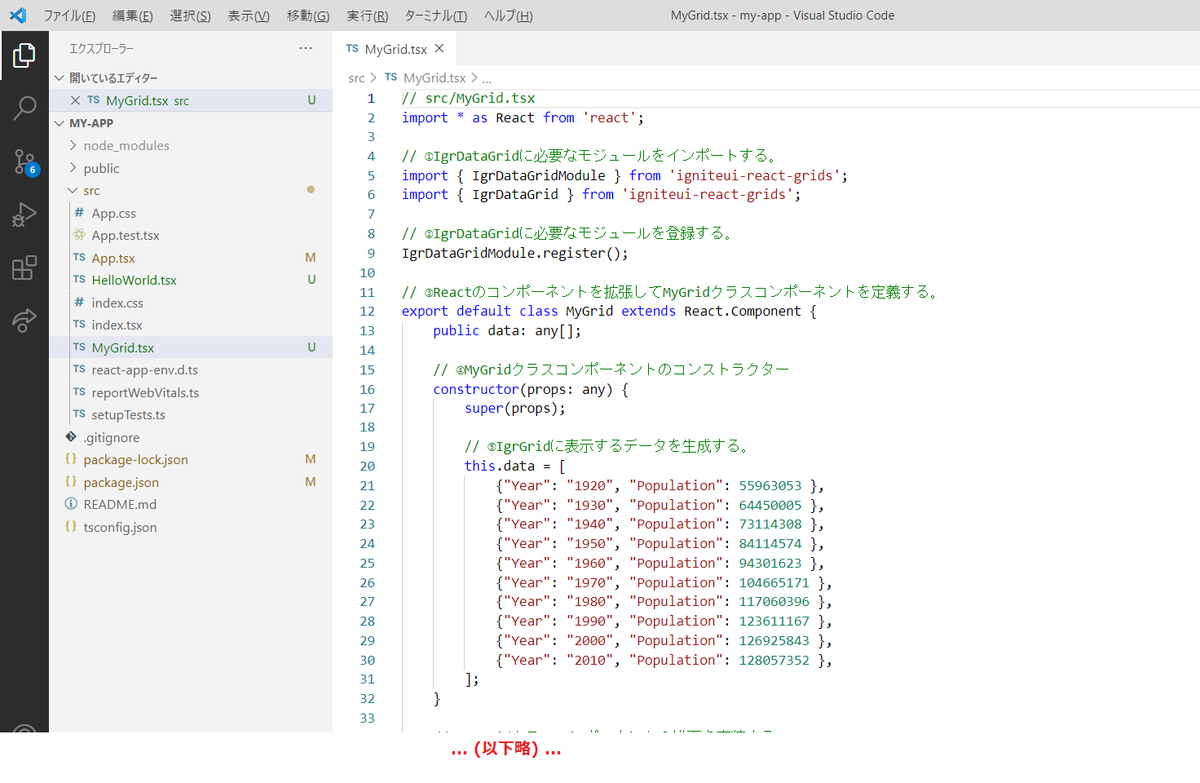
新規作成した MyGrid.tsx を開き、以下のコードを貼り付け、保存します。
// src/MyGrid.tsx
import * as React from 'react';

// ①IgrDataGridに必要なモジュールをインポートする。
import { IgrDataGridModule } from 'igniteui-react-grids';
import { IgrDataGrid } from 'igniteui-react-grids';

// ②IgrDataGridに必要なモジュールを登録する。
IgrDataGridModule.register();

// ③Reactのコンポーネントを拡張してMyGridクラスコンポーネントを定義する。
export default class MyGrid extends React.Component {
    public data: any[];

    // ④MyGridクラスコンポーネントのコンストラクター
    constructor(props: any) {
        super(props);

        // ⑤IgrGridに表示するデータを生成する。
        this.data = [
            {"Year": "1920", "Population": 55963053 },
            {"Year": "1930", "Population": 64450005 },
            {"Year": "1940", "Population": 73114308 },
            {"Year": "1950", "Population": 84114574 },
            {"Year": "1960", "Population": 94301623 },
            {"Year": "1970", "Population": 104665171 },
            {"Year": "1980", "Population": 117060396 },
            {"Year": "1990", "Population": 123611167 },
            {"Year": "2000", "Population": 126925843 },
            {"Year": "2010", "Population": 128057352 },
        ];
    }

    // ⑥MyGridクラスコンポーネントの描画を実装する。
    // ※render()メソッドはクラスコンポーネントで必ず定義しなければならない唯一のメソッドです。
    public render() {
        return(
          <div style={{margin: "1em"}}>
            {/*
              ⑦IgrDataGridを配置する。
              dataSource: 表示するデータソースを指定する。
              autoGenerateColumns: 列を自動生成するかどうか指定する。trueは自動生成する。falseは自動生成しない。
            */}
            <IgrDataGrid style={{margin: "1em"}}
              height="300px"
              width="100%"
              dataSource={this.data}
              autoGenerateColumns="true"
              />
            </div>
        );
    }
}
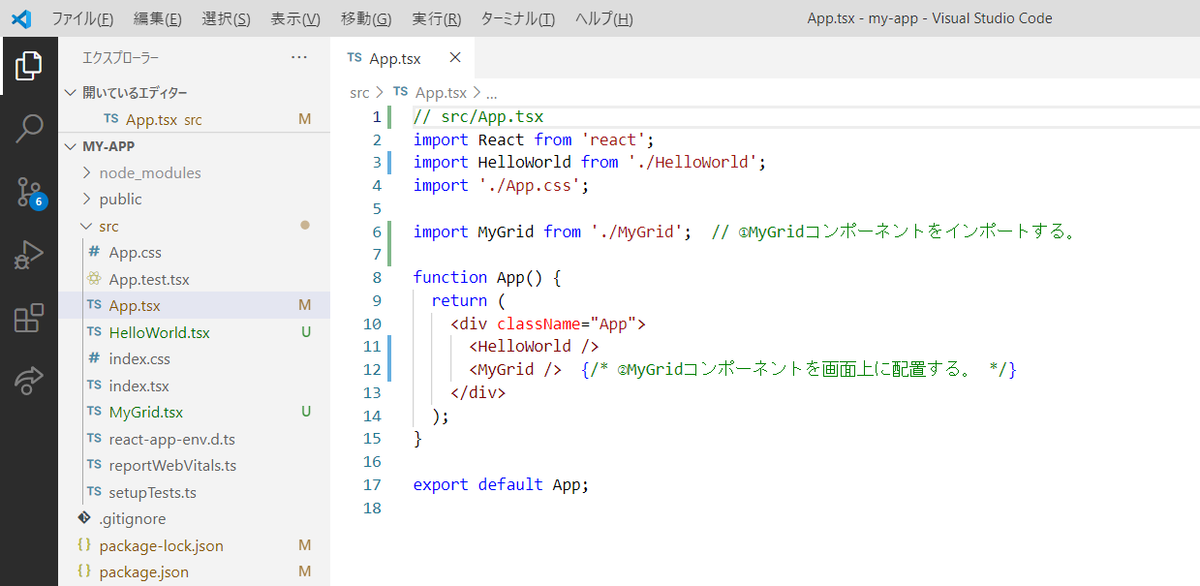
MyGrid コンポーネントを画面に配置する。
HelloWorld コンポーネントを画面に配置したときと同じように、src/App.jsx を開いて MyGrid コンポーネントのインポートと配置をします。
// src/App.tsx
import React from 'react';
import HelloWorld from './HelloWorld';
import './App.css';

import MyGrid from './MyGrid'; // ①MyGridコンポーネントをインポートする。

function App() {
    return (
        <div className="App">
            <HelloWorld />
            <MyGrid /> {/* ②MyGridコンポーネントを画面上に配置する。 */}
        </div>
    )
}

export default App;
ファイルをすべて保存して、プロンプトを開き、"npm start" を実行します。ブラウザーの "Hello World!" の下に表が表示されていれば OK です。
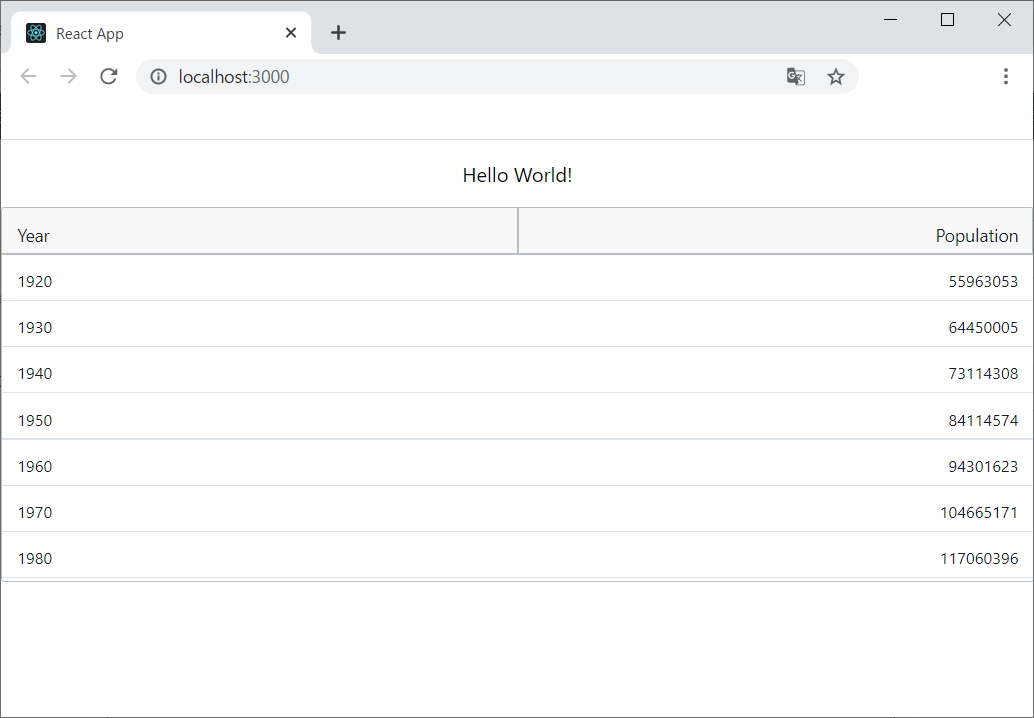
これでグリッドの表示までできました! あともう一息です。
次回はチャートの表示をしてみましょう。
最後に
以上、グリッドの表示のさせ方を見てきました。次回は、同じように Ignite UI for React のチャートを表示させてみましょう。
この記事に関して何かご質問・ご不明な点がありましたら、お気兼ねなくインフラジスティックスまでお問い合わせください。